API Monitoring and Logging Setup for Small Teams
Last reviewed: 2026-05-10. This EskiLab guide is written as a practical technical playbook, not a generic overview. It is designed to help teams build, test, fix, and monitor a working system around API monitoring and logging.
If your team is dealing with API integrations failing without clear visibility into status codes, latency, retries, payload quality, or downstream impact, the expensive mistake is usually not the first error. The expensive mistake is having no repeatable process for diagnosis, testing, ownership, and monitoring. This guide gives you a system you can adapt before the problem becomes a production habit.
What this solves
This guide helps with API integrations failing without clear visibility into status codes, latency, retries, payload quality, or downstream impact. It focuses on practical implementation decisions: what to define, what to log, what to test, what to avoid, and how to know whether the system is actually working after deployment.
Who this is for
This playbook is for small technical teams, automation operators, e-commerce teams, and marketers managing integrations without a full observability team. You do not need a large engineering team to use it, but you do need a clear owner, a testing habit, and a willingness to document decisions instead of leaving them inside one person’s head.
Short answer
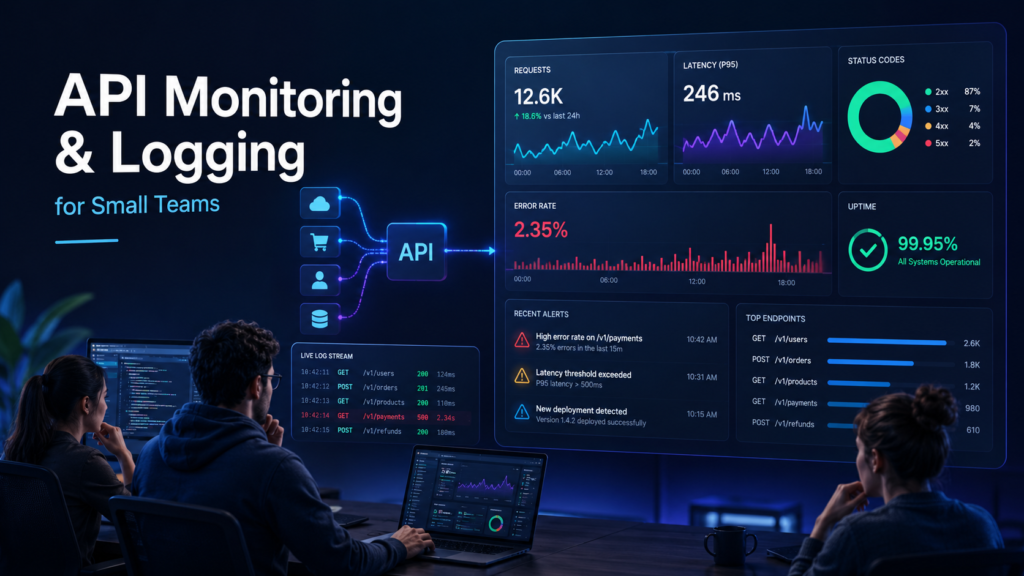
A practical API monitoring setup tracks status codes, latency, retry counts, provider errors, payload validation failures, and business outcomes, while protecting secrets and customer data from logs.
When this problem usually happens
The issue usually appears when a workflow grows from a one-off setup into something the business depends on. A manual workaround may feel fine at low volume, but once traffic, records, events, or team members increase, undocumented assumptions become failure points.
Common triggers include platform updates, API version changes, new content batches, new product catalogs, automation retries, AI tool expansion, schema changes, or a new team member editing a workflow without knowing the original design assumptions.
Root causes and fast diagnosis
| Symptom | Likely cause | What to check first |
|---|---|---|
| Integration looks healthy but data is missing | only uptime is monitored, not record counts | Track processed records and downstream writes. |
| Errors are noticed too late | no alert thresholds or owner | Define alert conditions and response responsibility. |
| Logs are unsafe | tokens and full payloads are stored | Redact secrets and sensitive fields. |
| Debugging takes hours | no request correlation ID | Add a trace ID across fetch, transform, and write steps. |
Use this table as the first diagnostic layer. Do not jump directly to rewriting the whole system. In most cases, the fastest path is to isolate whether the failure comes from input data, configuration, permissions, transformation logic, timing, or monitoring gaps.
Step-by-step implementation system
- Define the integration’s business outcome, such as orders synced, leads created, or products updated.
- Log every request with timestamp, endpoint group, status code, duration, attempt number, and correlation ID.
- Redact API keys, authorization headers, tokens, personal data, and full payment details.
- Track provider-level errors separately from internal validation errors.
- Create alert thresholds for repeated 401, 403, 429, 500, timeout, and schema validation failures.
- Store a small sample of sanitized failed payloads for debugging.
- Build a daily or weekly review of error count, latency, retry volume, and processed records.
- Document the runbook for the most common incidents.
The important part is not only completing the steps once. The goal is to make the system repeatable. A future teammate should be able to read the workflow, understand the expected input and output, run a safe test, and know when to escalate.
Example setup
A Shopify product sync can log product ID, variant count, request duration, API version, response status, retry count, and whether the downstream SEO field update succeeded. It should not log full customer records or tokens.
A good example setup has three layers: a safe test case, a production rule, and a monitoring rule. The test case proves the logic works. The production rule explains when it is allowed to run. The monitoring rule tells the team when the system has drifted away from expected behavior.
Common mistakes
- Monitoring only whether the server is up.
- Logging secrets in error messages.
- Sending every minor warning to Slack until the team ignores alerts.
- Not separating provider downtime from bad local data.
- Using no correlation ID across multi-step workflows.
- Never reviewing successful runs for unusual counts.
Risks and limitations
- Over-logging can create privacy and compliance problems.
- Under-logging makes outages expensive to diagnose.
- Alert fatigue can make real incidents invisible.
- Provider API changes can create silent partial failures.
- Monitoring dashboards can become stale if nobody owns them.
These risks do not mean the system should not be used. They mean the system needs boundaries. EskiLab’s standard is to define safe operating limits before scaling: what the workflow can do, what it cannot do, what requires review, and what should trigger an alert.
Testing checklist
Before treating this as production-ready, confirm the following:
- [ ] Every failed request has a status code and endpoint group.
- [ ] Secrets are redacted from logs.
- [ ] A correlation ID follows the record across the workflow.
- [ ] 429 and 5xx errors trigger different responses.
- [ ] The dashboard includes business counts, not only technical errors.
- [ ] There is a documented incident owner.
Recommended setup
For most small teams, the recommended setup is to start with a controlled version of API monitoring and logging, add validation before production actions, keep logs small but useful, monitor the system weekly, and update the playbook whenever a real failure teaches you something new.
Official documentation to check
Related systems
- API Error Handling and Retry Logic
- REST API Pagination
- Webhook Signature Verification
FAQ
Is API monitoring and logging a one-time setup?
No. Treat API monitoring and logging as an operating system that needs review after platform updates, traffic changes, schema changes, or workflow failures.
What should I test first?
Start with the smallest safe test case, confirm the expected output, then test edge cases, failures, duplicates, and permission boundaries.
Can this system guarantee results?
No. It can reduce risk and improve consistency, but technical systems still depend on data quality, implementation accuracy, monitoring, and maintenance.
Who should own the workflow?
Assign one operational owner for the workflow, one technical owner for implementation, and one reviewer for quality or business impact when the system affects customers, publishing, or revenue.
How often should this be reviewed?
Review high-impact workflows monthly and after every major CMS, API, theme, plugin, model, or platform change.